Flood zones, flood claims and storm reports in 22 Florida cities
All figures are for the whole county. Not available means FEMA's county figures for the flood zone are inconsistent (more flood-zone policies than flood-zone homes), so we left them out.
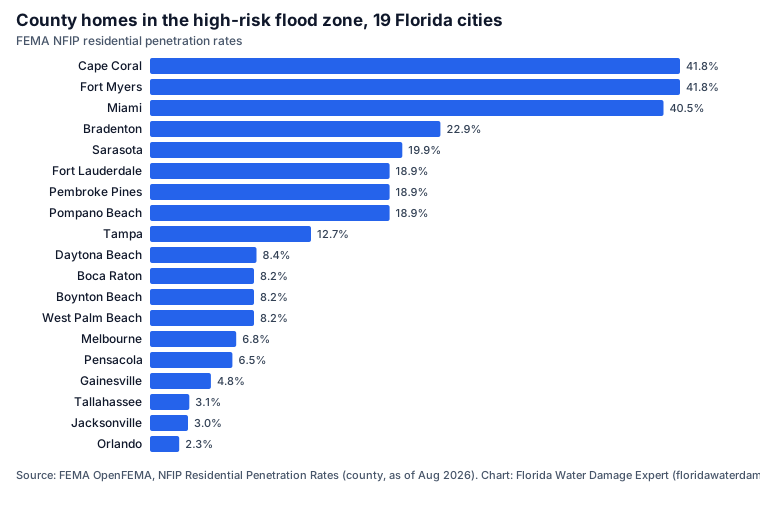
| City | County homes in the high-risk flood zone | Flood insurance claims, 2014-2023 | Flood reports, 2015-2024 | Flash-flood reports, 2015-2024 | Tropical storm and hurricane reports, 2015-2024 | County |
|---|---|---|---|---|---|---|
| Cape Coral | 41.8% | 31,948 | 20 | n/a | 21 | Lee County |
| Fort Myers | 41.8% | 31,948 | 20 | n/a | 21 | Lee County |
| Miami | 40.5% | 7,166 | 95 | 36 | 16 | Miami-Dade County |
| Bradenton | 22.9% | 1,162 | 10 | 1 | 29 | Manatee County |
| Sarasota | 19.9% | 1,873 | 11 | 1 | 22 | Sarasota County |
| Fort Lauderdale | 18.9% | 8,085 | 59 | 14 | 14 | Broward County |
| Pembroke Pines | 18.9% | 8,085 | 59 | 14 | 14 | Broward County |
| Pompano Beach | 18.9% | 8,085 | 59 | 14 | 14 | Broward County |
| Tampa | 12.7% | 1,990 | 20 | n/a | 30 | Hillsborough County |
| Daytona Beach | 8.4% | 5,763 | 9 | 4 | 19 | Volusia County |
| Boca Raton | 8.2% | 1,456 | 46 | 20 | 19 | Palm Beach County |
| Boynton Beach | 8.2% | 1,456 | 46 | 20 | 19 | Palm Beach County |
| West Palm Beach | 8.2% | 1,456 | 46 | 20 | 19 | Palm Beach County |
| Melbourne | 6.8% | 1,381 | 8 | 6 | 43 | Brevard County |
| Pensacola | 6.5% | 4,301 | n/a | 31 | 12 | Escambia County |
| Gainesville | 4.8% | 144 | 26 | 2 | 13 | Alachua County |
| Tallahassee | 3.1% | 60 | 13 | 60 | 10 | Leon County |
| Jacksonville | 3.0% | 3,137 | 72 | 21 | 23 | Duval County |
| Orlando | 2.3% | 1,249 | 7 | 4 | 6 | Orange County |
| Clearwater | Not available | 4,248 | 7 | 1 | 34 | Pinellas County |
| Largo | Not available | 4,248 | 7 | 1 | 34 | Pinellas County |
| Naples | Not available | 10,898 | 23 | 5 | 15 | Collier County |
Sources: FEMA OpenFEMA, NFIP Residential Penetration Rates (county, as of Aug 2026); FEMA OpenFEMA, NFIP redacted claims, 2014-2023; NOAA NCEI Storm Events Database, 2015-2024 (county reports). Download the data (CSV).
What the high-risk flood zone means
FEMA's Special Flood Hazard Area is land with a 1 percent or greater chance of flooding in any year. Homes outside it can still flood; many flood claims come from outside the zone.
After a flood
- Photograph the water line and damaged items before cleanup, and contact your insurer.
- The EPA advises drying water-damaged areas within 24 to 48 hours to prevent mold growth.
- Ask any restoration provider for a written scope that lists what will be removed, dried and checked.
Common questions
Is my Florida home in a flood zone?
Look up your address on FEMA's flood maps. The table shows the share of homes in each county that sit in the high-risk zone.
Do homes outside the flood zone flood?
Yes. Heavy rain and storm surge can reach beyond mapped zones, which is why flood claims also come from outside high-risk areas.
Sources and method
- FEMA OpenFEMA: NFIP residential penetration rates — Residential structures in the Special Flood Hazard Area by county (as of Aug 2026).
- FEMA OpenFEMA: NFIP redacted claims — Claim counts 2014-2023.
- NOAA NCEI Storm Events Database — County reports, 2015-2024.
- FEMA: Flood maps — How to look up an address on FEMA's flood maps.